What is earnings per share (EPS) and what does it tell me about a stock?
Quick answer EPS (earnings per share) measures a company’s net income divided by its shares outstanding and shows profit attributable to each share. Look at diluted vs basic EPS, EPS growth rates, and multi-quarter trends to judge profitability momentum — not just the headline EPS number.
Key takeaways
- EPS = net income / weighted average shares outstanding; it measures profit per share.
- Diluted EPS accounts for potential shares from options, convertibles, and warrants; basic EPS does not.
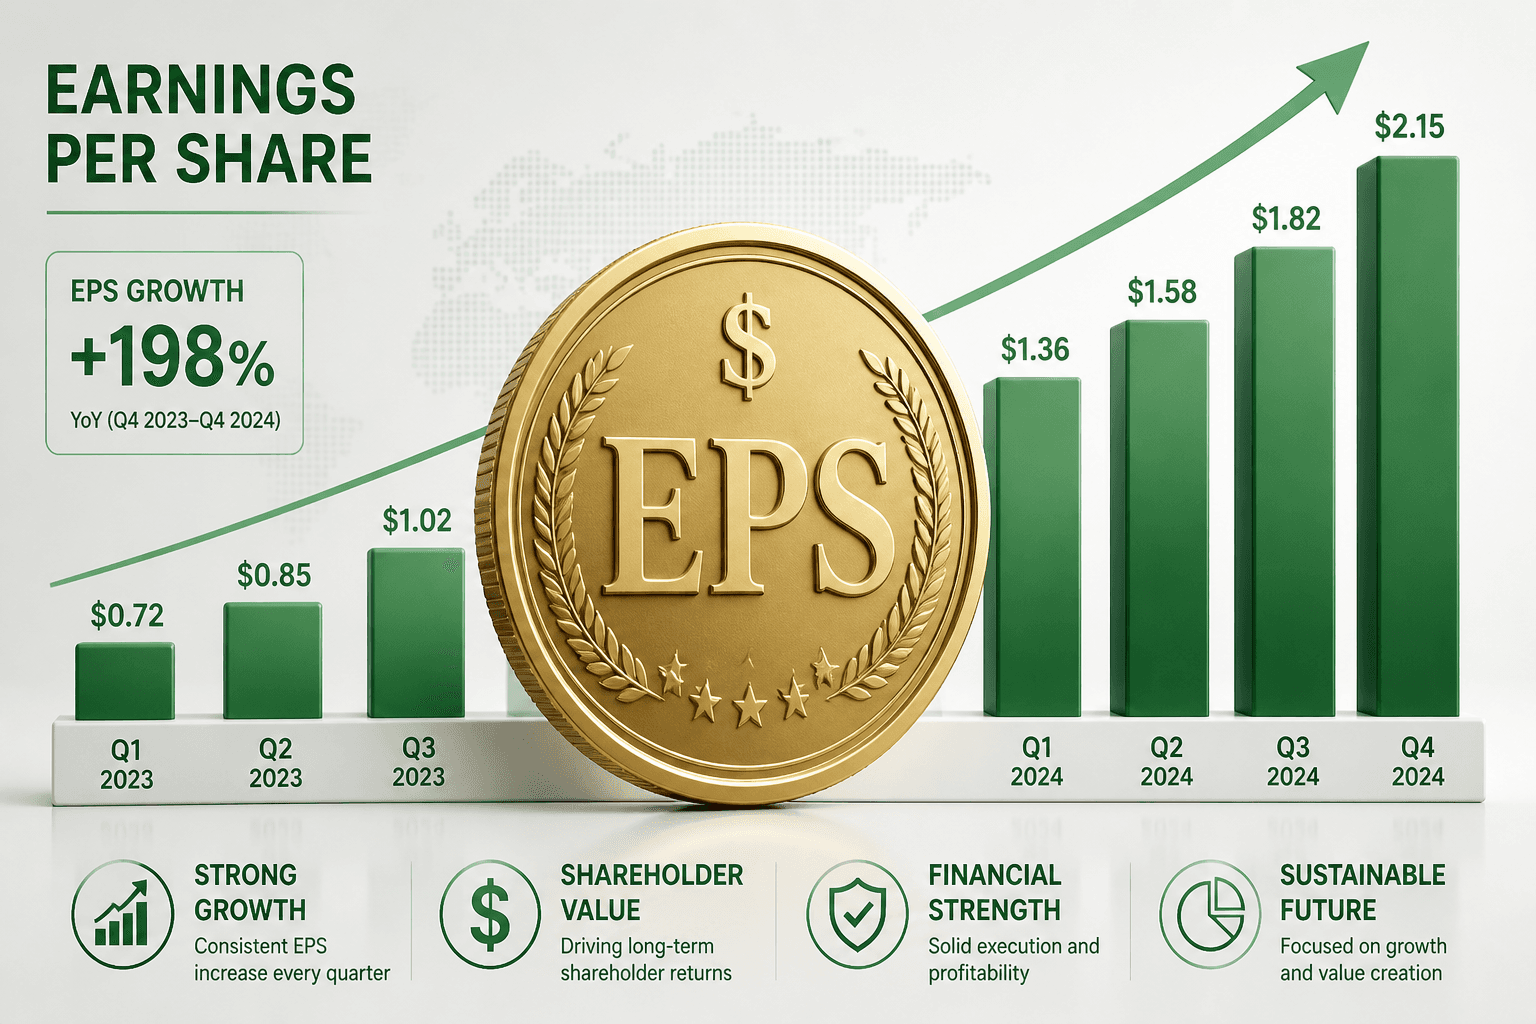
- EPS growth (percentage change) usually matters more than the absolute EPS figure when evaluating momentum.
- Use multi-quarter and trailing-12-month (TTM) EPS to smooth seasonality and one-time items.
- Stock prices react to EPS surprises, trends, and how those results change valuation metrics like the P/E ratio.
What exactly is EPS?
Earnings per share (EPS) is a profitability metric that shows how much net income (profit after expenses and taxes) a company earned for each share of common stock. The basic formula is: EPS = Net Income / Weighted Average Shares Outstanding.
Define "weighted average shares outstanding": the average number of shares available during the reporting period, adjusted for stock issuances or buybacks. EPS tells investors the per-share slice of profit — useful because companies have different share counts.
What’s the difference between basic EPS and diluted EPS?
Basic EPS uses the weighted average shares outstanding without considering securities that could convert into common shares. Diluted EPS includes the impact of potential dilution from stock options, convertible bonds, warrants, and other convertible securities.
Diluted EPS is always equal to or lower than basic EPS because it assumes the maximum potential increase in share count. For companies with heavy employee stock-option programs (common at tech names like AAPL or MSFT), watch diluted EPS to see the worst-case dilution effect on per-share profit.
Why does EPS growth matter more than the absolute EPS number?
Absolute EPS is partly a function of company size: a large bank like JPMorgan Chase (JPM) will have a different EPS scale than a mid-cap tech firm. EPS growth — the percentage increase or decrease versus prior periods — shows change in profitability and momentum.
Investors prefer companies with consistent EPS growth because future earnings power is what supports higher stock valuations. A company with EPS rising 20% year-over-year is usually more attractive than one with a higher absolute EPS but flat or falling profits.
How should I use EPS trends across multiple quarters?
Don’t judge a company on a single quarter. Look at trailing-12-month (TTM) EPS and year-over-year (YoY) quarterly growth to smooth seasonality and one-time gains or losses. Compare at least 4-8 quarters to spot trends: accelerating growth, deceleration, or stable earnings.
Adjust for one-time items (restructuring charges, asset sales) that can spike or depress EPS. Also watch share buybacks: buybacks reduce share count and can boost EPS even if net income is unchanged. Use diluted EPS to avoid being misled by buyback-driven per-share increases.
Practical step: run a multi-quarter EPS scan in a tool like our stock screener to find companies with consistent YoY EPS improvement and a stable diluted/basic gap.
How does EPS relate to stock price movement?
EPS drives valuation via the price-to-earnings (P/E) ratio, which equals stock price divided by EPS. If EPS rises while the P/E stays constant, the stock price can rise proportionally. Conversely, falling EPS can compress prices unless the P/E expands.
Short-term stock moves often react to earnings surprises versus analyst estimates. If Microsoft (MSFT) reports a higher-than-expected diluted EPS, its stock may gap up as investors revise growth expectations. Over the long term, sustained EPS growth supports higher valuations and price appreciation.
Remember market psychology: an earnings beat matters more when it signals a durable change in margins or revenue — not just a one-off benefit like a tax credit.
Can EPS be misleading?
Yes. EPS can be distorted by accounting items, non-recurring gains, share buybacks, or share issuances. A company can show rising EPS while underlying revenue and margins are weakening, if it aggressively repurchases shares.
To avoid being misled, always:
- Compare basic and diluted EPS.
- Check revenue growth and operating margins.
- Remove one-time items or look at adjusted EPS.
- Review cash flow metrics and segment results on the company’s stock pages.
How do analysts’ EPS estimates and guidance affect stocks?
Analysts publish EPS estimates; companies provide forward guidance. Stocks move when reported EPS beats or misses estimates because that updates expectations for future cash flows. A modest beat with weak guidance can still send a stock lower, while a small miss with strong guidance can lift it.
Earnings seasons amplify this effect. Use our market heatmap to see which sectors and S&P 500 names are showing the biggest EPS surprises.
FAQ
Q: Is a higher EPS always better? A: Not necessarily. A higher EPS can reflect a large company scale or buybacks. Look at EPS growth, margins, and revenue to judge quality.
Q: What is adjusted EPS? A: Adjusted EPS excludes one-time or non-recurring items (e.g., restructuring costs) to show recurring profitability. Companies and analysts often report both GAAP and adjusted EPS.
Q: How should I compare EPS across companies? A: Use EPS growth rates, margins, and P/E ratios rather than raw EPS. Compare companies within the same industry to control for different business models.
Q: Does diluted EPS affect valuation? A: Yes. Diluted EPS gives a fuller picture of future share count. Valuations based on basic EPS can understate potential dilution and overstate per-share earnings.
Q: Can companies manipulate EPS? A: Some practices (timing of expenses, buybacks, non-recurring adjustments) can influence EPS. Cross-check earnings with cash flow and revenue trends to reduce manipulation risk.
Q: How often is EPS reported? A: Public companies report EPS quarterly and annually in their financial statements and earnings releases.
Closing — where to go next Want to screen for S&P 500 companies with steady EPS growth or compare diluted and basic EPS across peers? Try our [stock screener] to filter by EPS growth and diluted/basic spreads. Check the [market heatmap] during earnings season to see sector-wide EPS surprises. For deeper company-level history, visit individual [stock pages], or read our latest [market analysis] and [sector overview] posts for context on earnings trends.
DailyFinz is data-driven and independent. We’re not providing buy/sell advice — use EPS as one input in a broader research process.
Related Topics